What we have found so far
A plasma etcher cut into 88 test wafers, ten at a time. We measured how deep it went at 89 spots on each one. Two things vary: each wafer comes out a little shallower than the one before, and the edge of every wafer etches far deeper than the middle.
Public Bosch DRIE dataset (Zenodo 17122442): 10 lots, 88 wafers × 89 metrology sites, 5 Hz process logs. Response: Si etch depth. Results below are observational; process-signal models are exploratory.
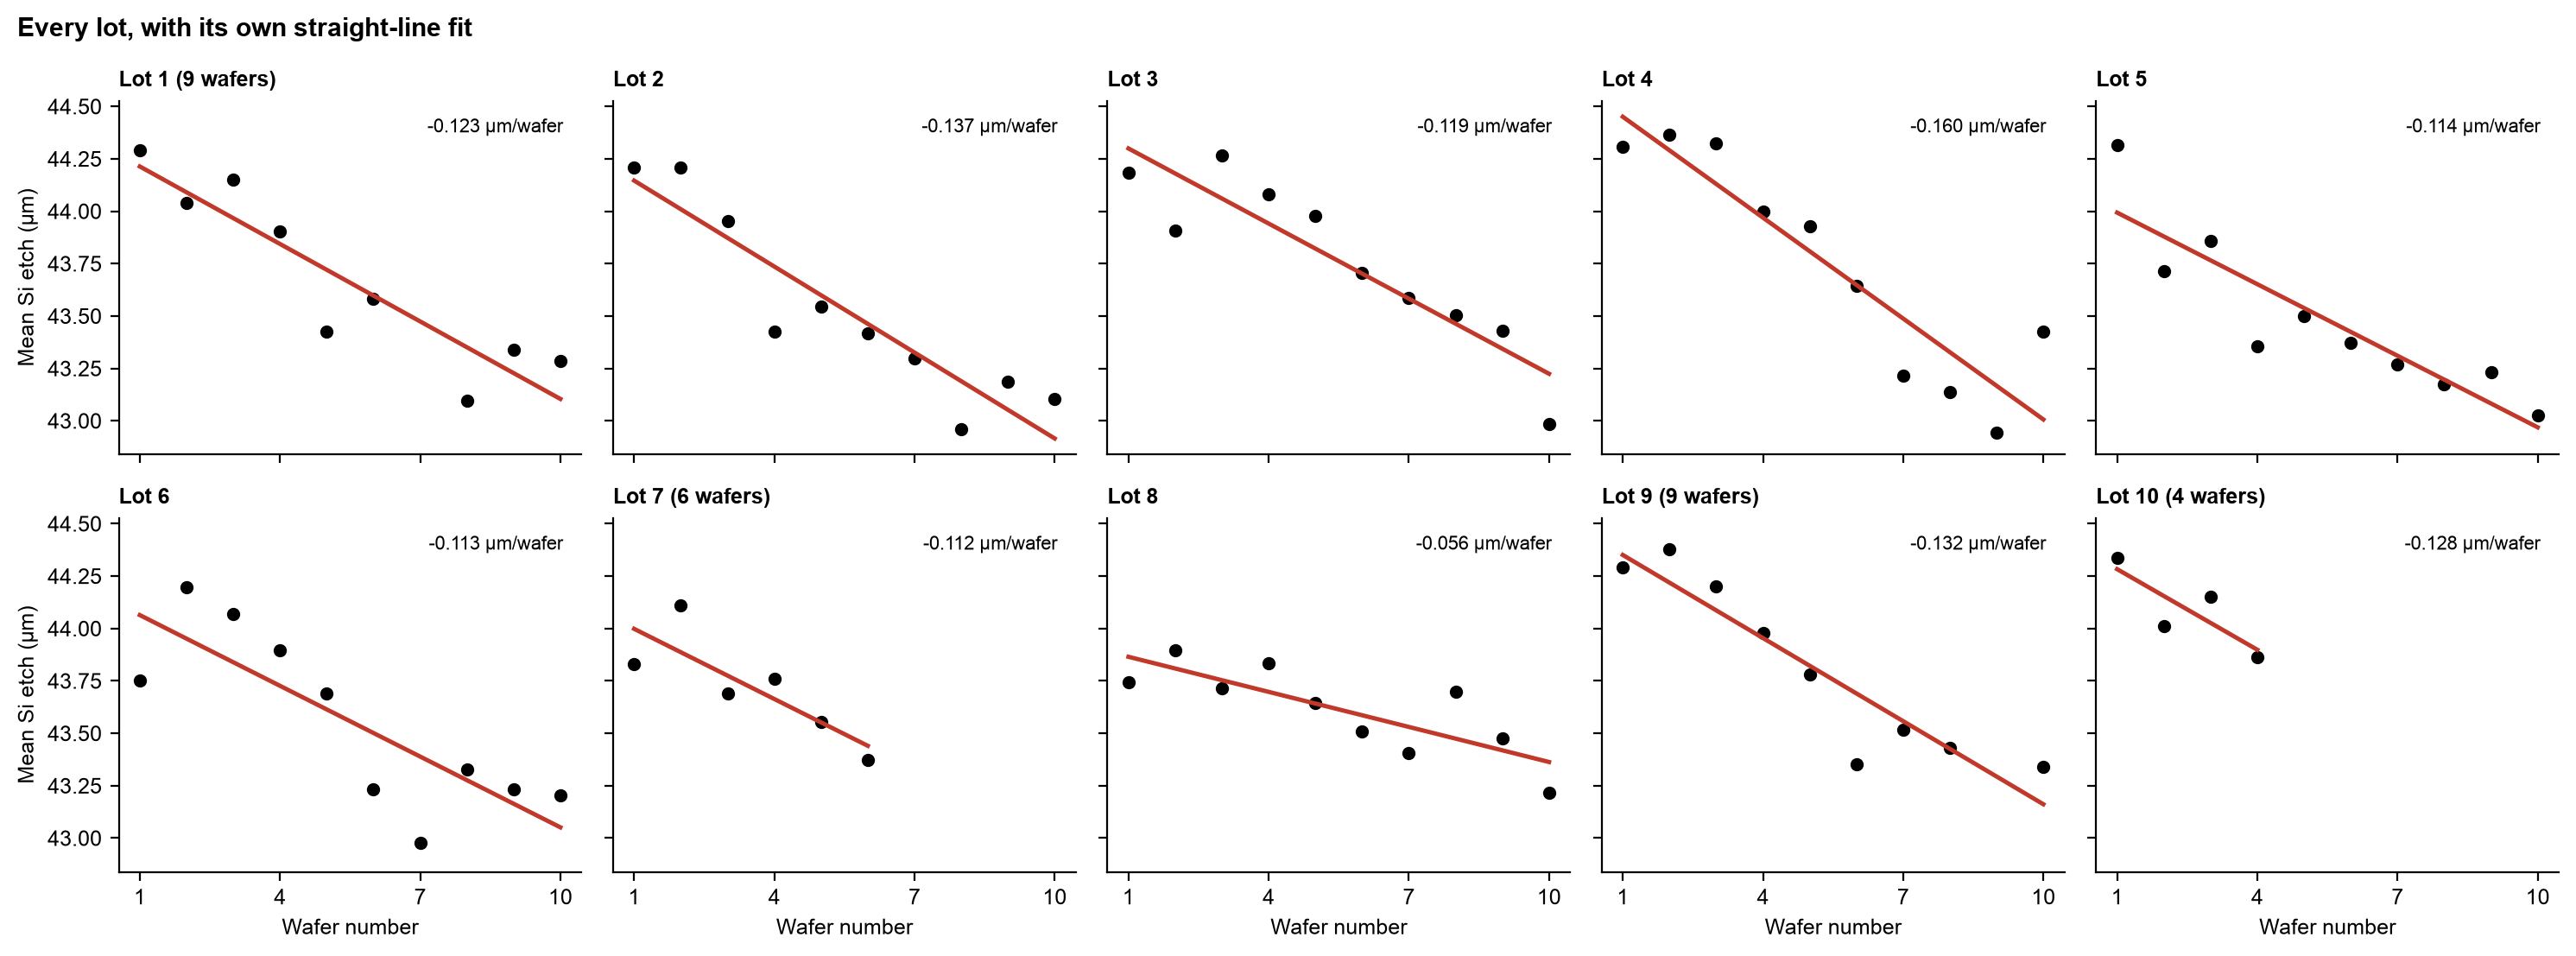
ConfirmedEach wafer in a run etches a little shallower than the one before, about 1 µm less by the tenth. It happens in every one of the ten runs.Shared within-lot slope −0.119 µm/wafer (95% CI −0.134 to −0.104), R² 0.79. All 10 lot slopes negative; lot-mean t interval −0.139 to −0.100.
See figure 1 →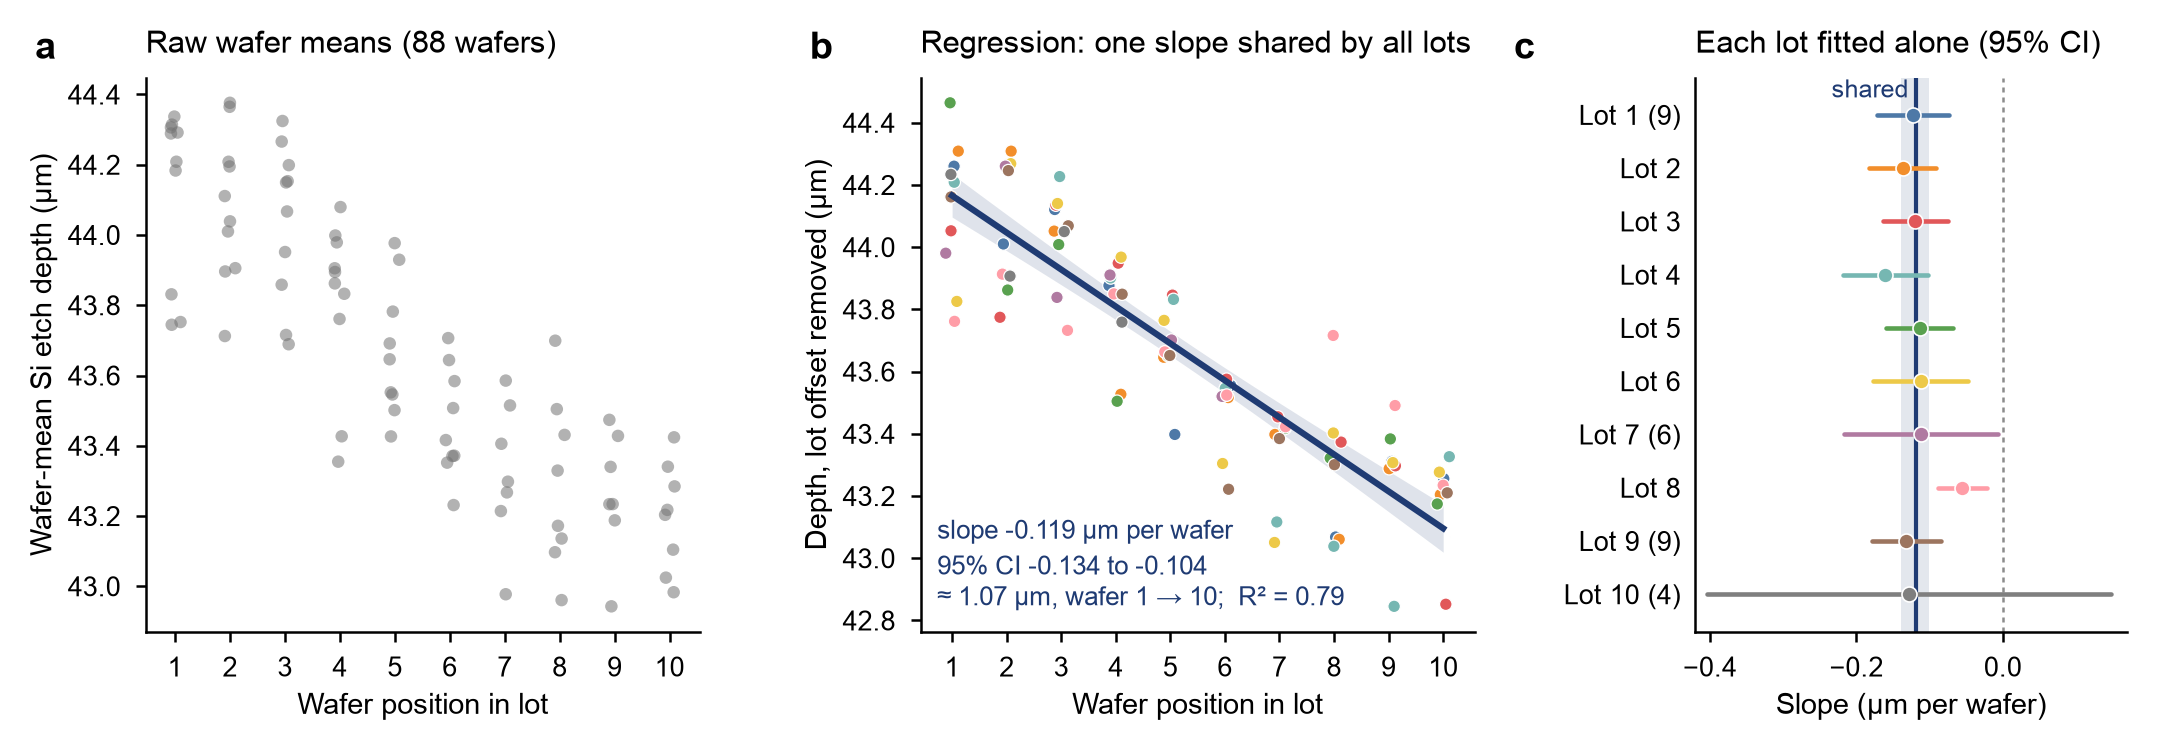
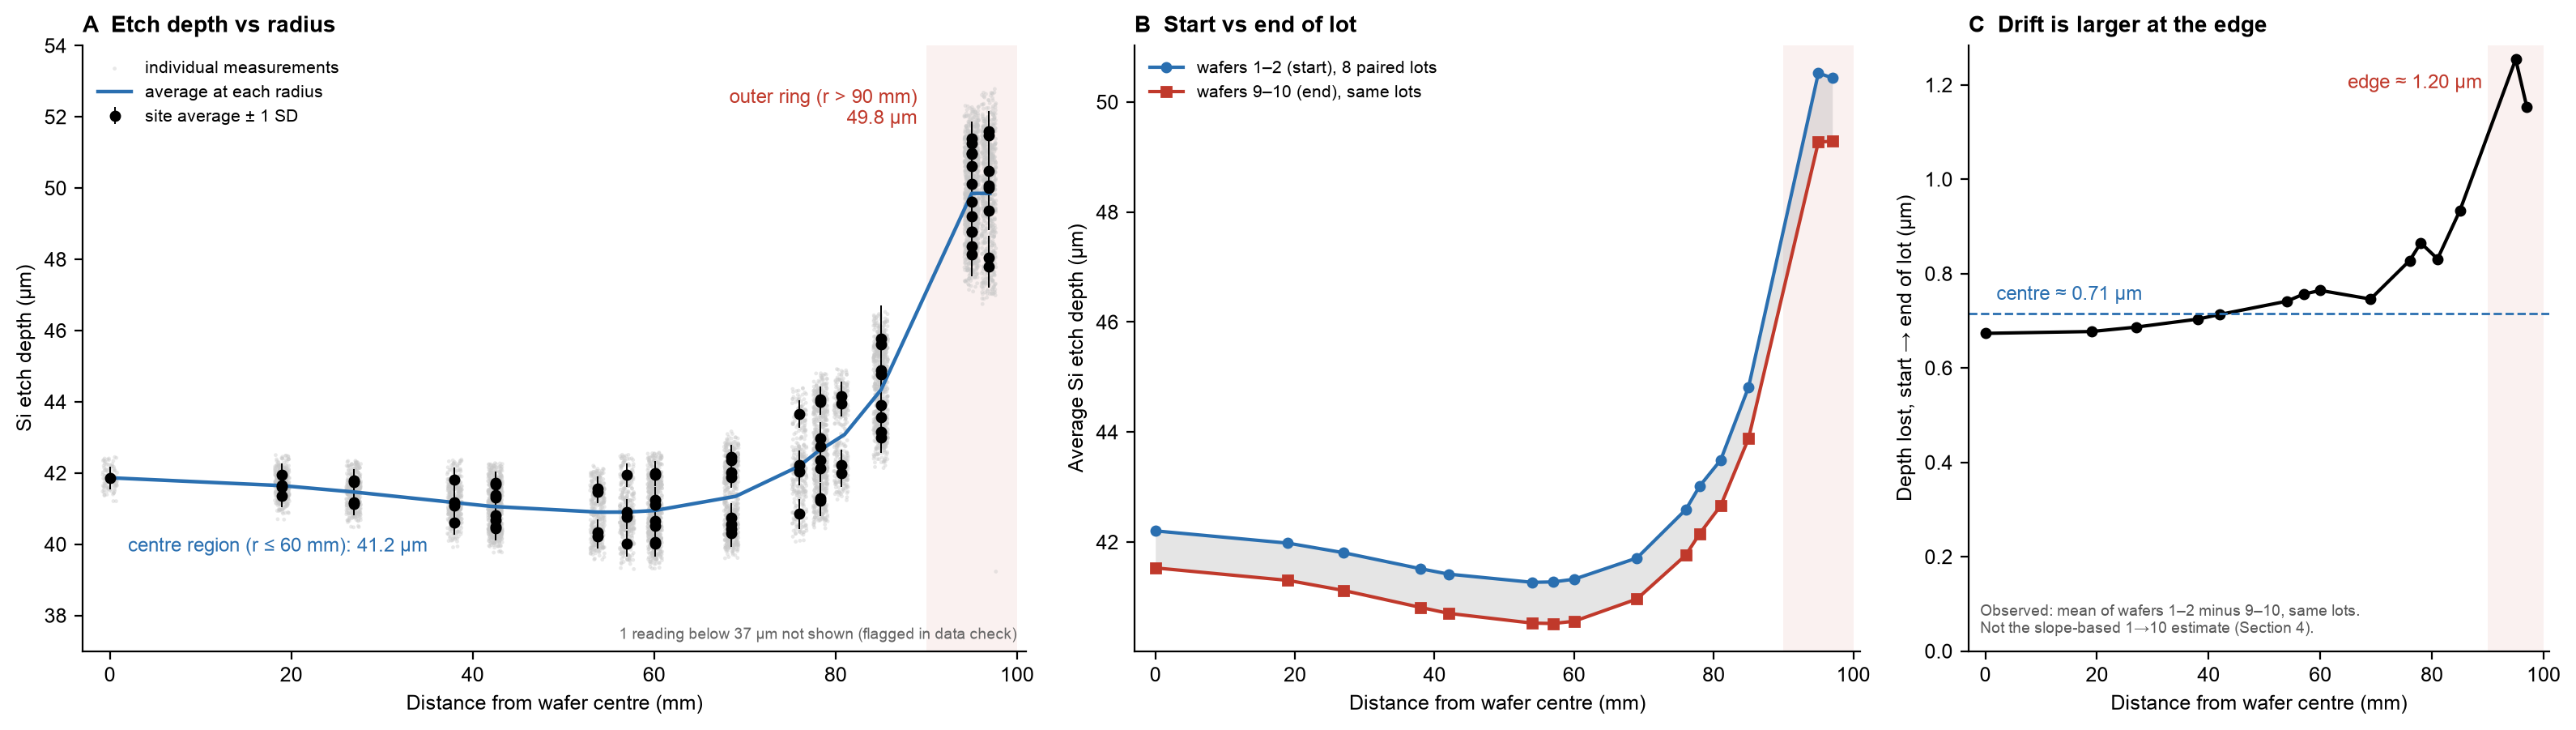
ConfirmedMost of the variation is across a single wafer, not between wafers. The outer rim etches about 50 µm deep, the middle about 41 µm.Within-wafer share of point variance 98.8 %. Outer ring (r > 90 mm) 49.8 µm vs 41.2 µm for r ≤ 60 mm. NU 8.26 % whole wafer, 3.27 % without the outer ring.
See figures 2–3 →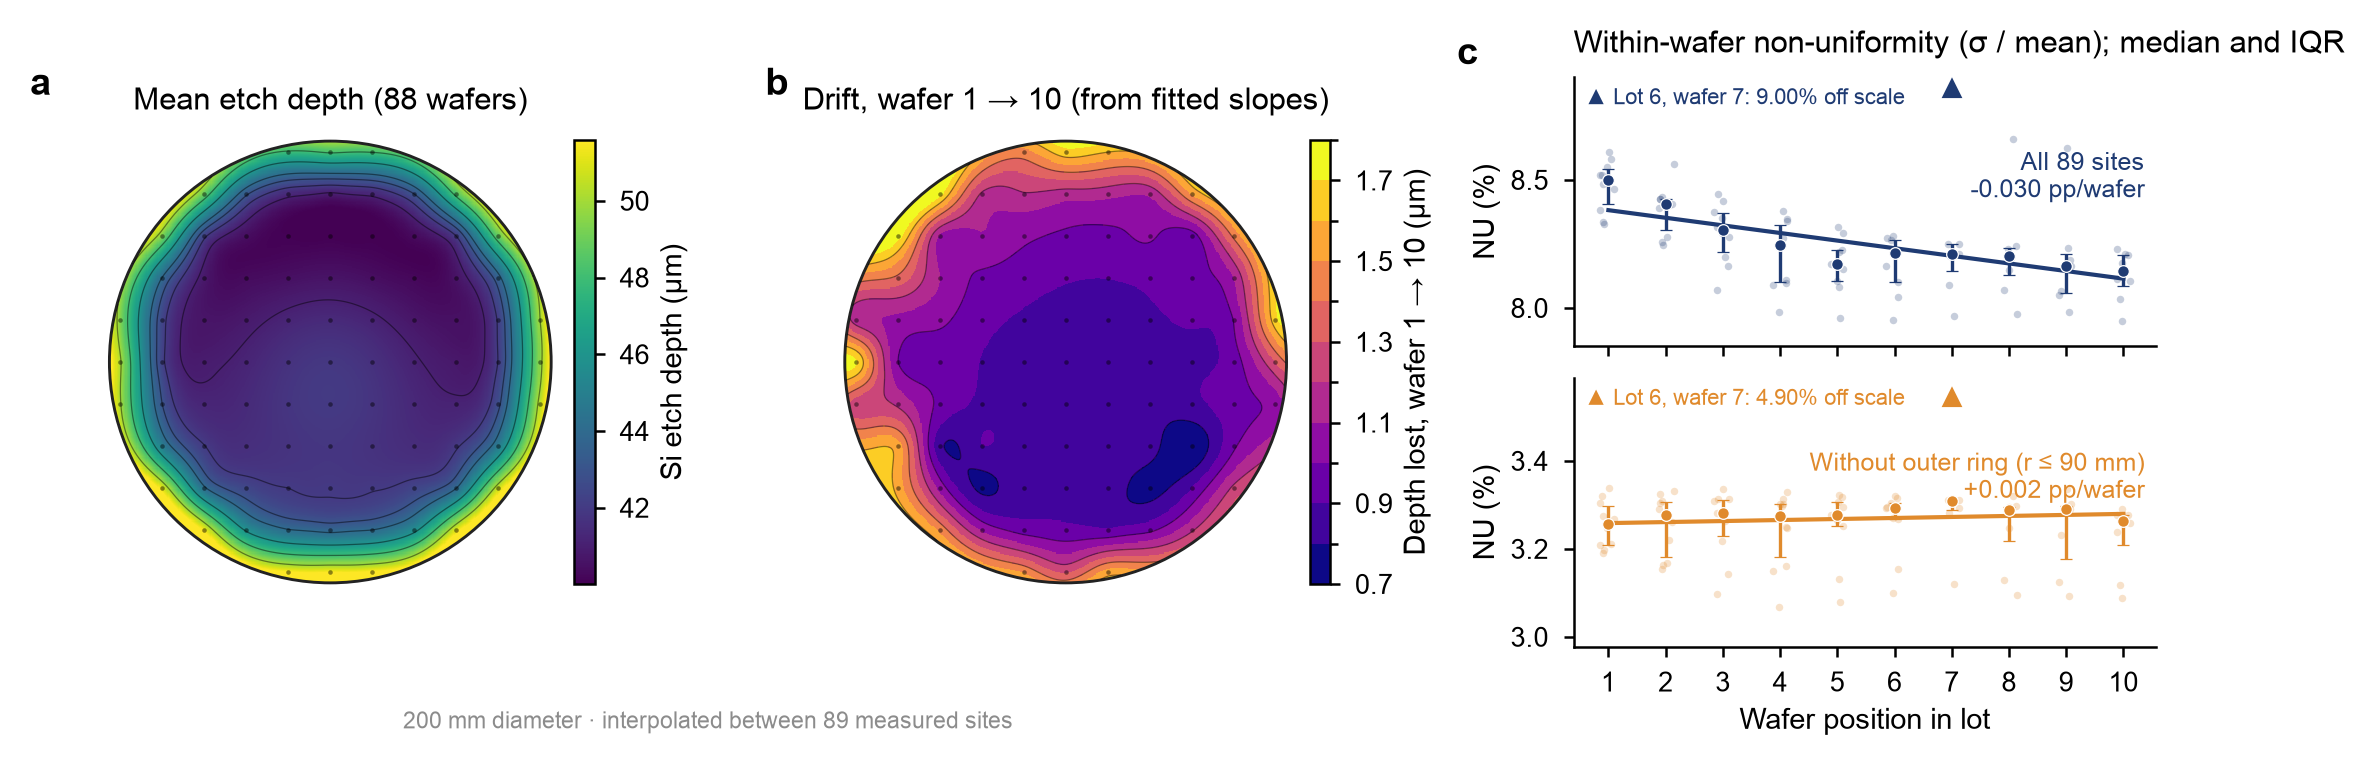
ConfirmedThe edge also loses depth fastest as the run goes on.Slope-based wafer 1 → 10 loss: 1.45 µm at r > 90 mm vs 0.88 µm at r ≤ 60 mm. Direct same-lot comparison to wafer 1 gives 1.37 vs 0.74 µm at wafer 10.
See figure 5 →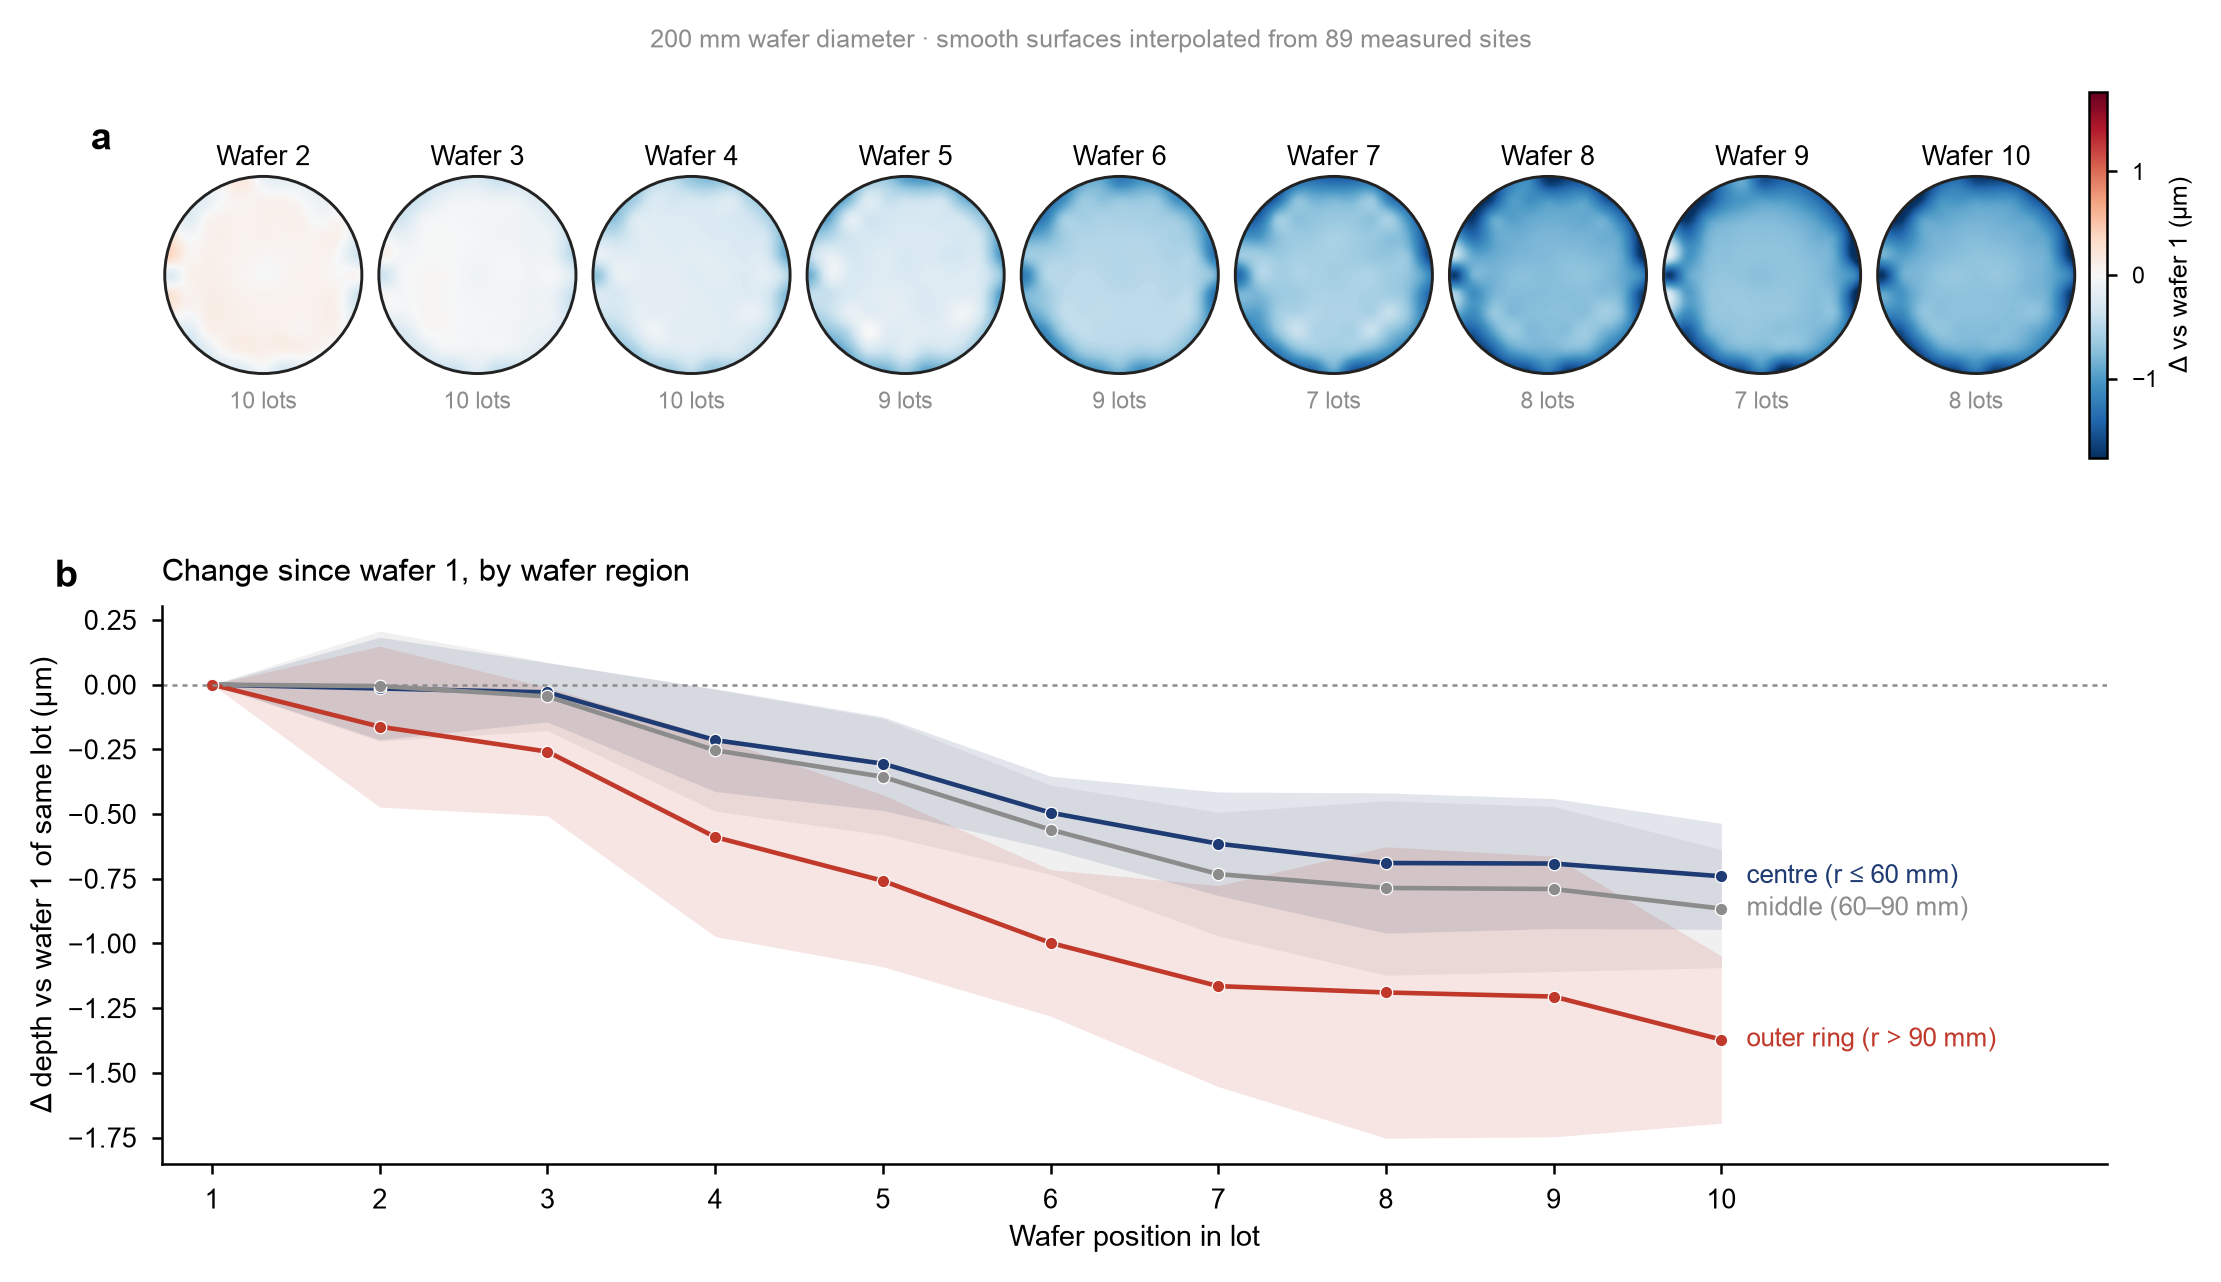
ExploratoryThe machine's own sensors move with the drift, but they don't predict it any better than simply counting wafers.Platen RF Vpp and source RF reflected power correlate with depth within lot (r ≈ −0.8), but leave-one-lot-out RMSE is 0.221 µm for wafer number vs ≥ 0.277 µm for signal-only models. Candidates for monitoring, not root causes.
See figure 4 →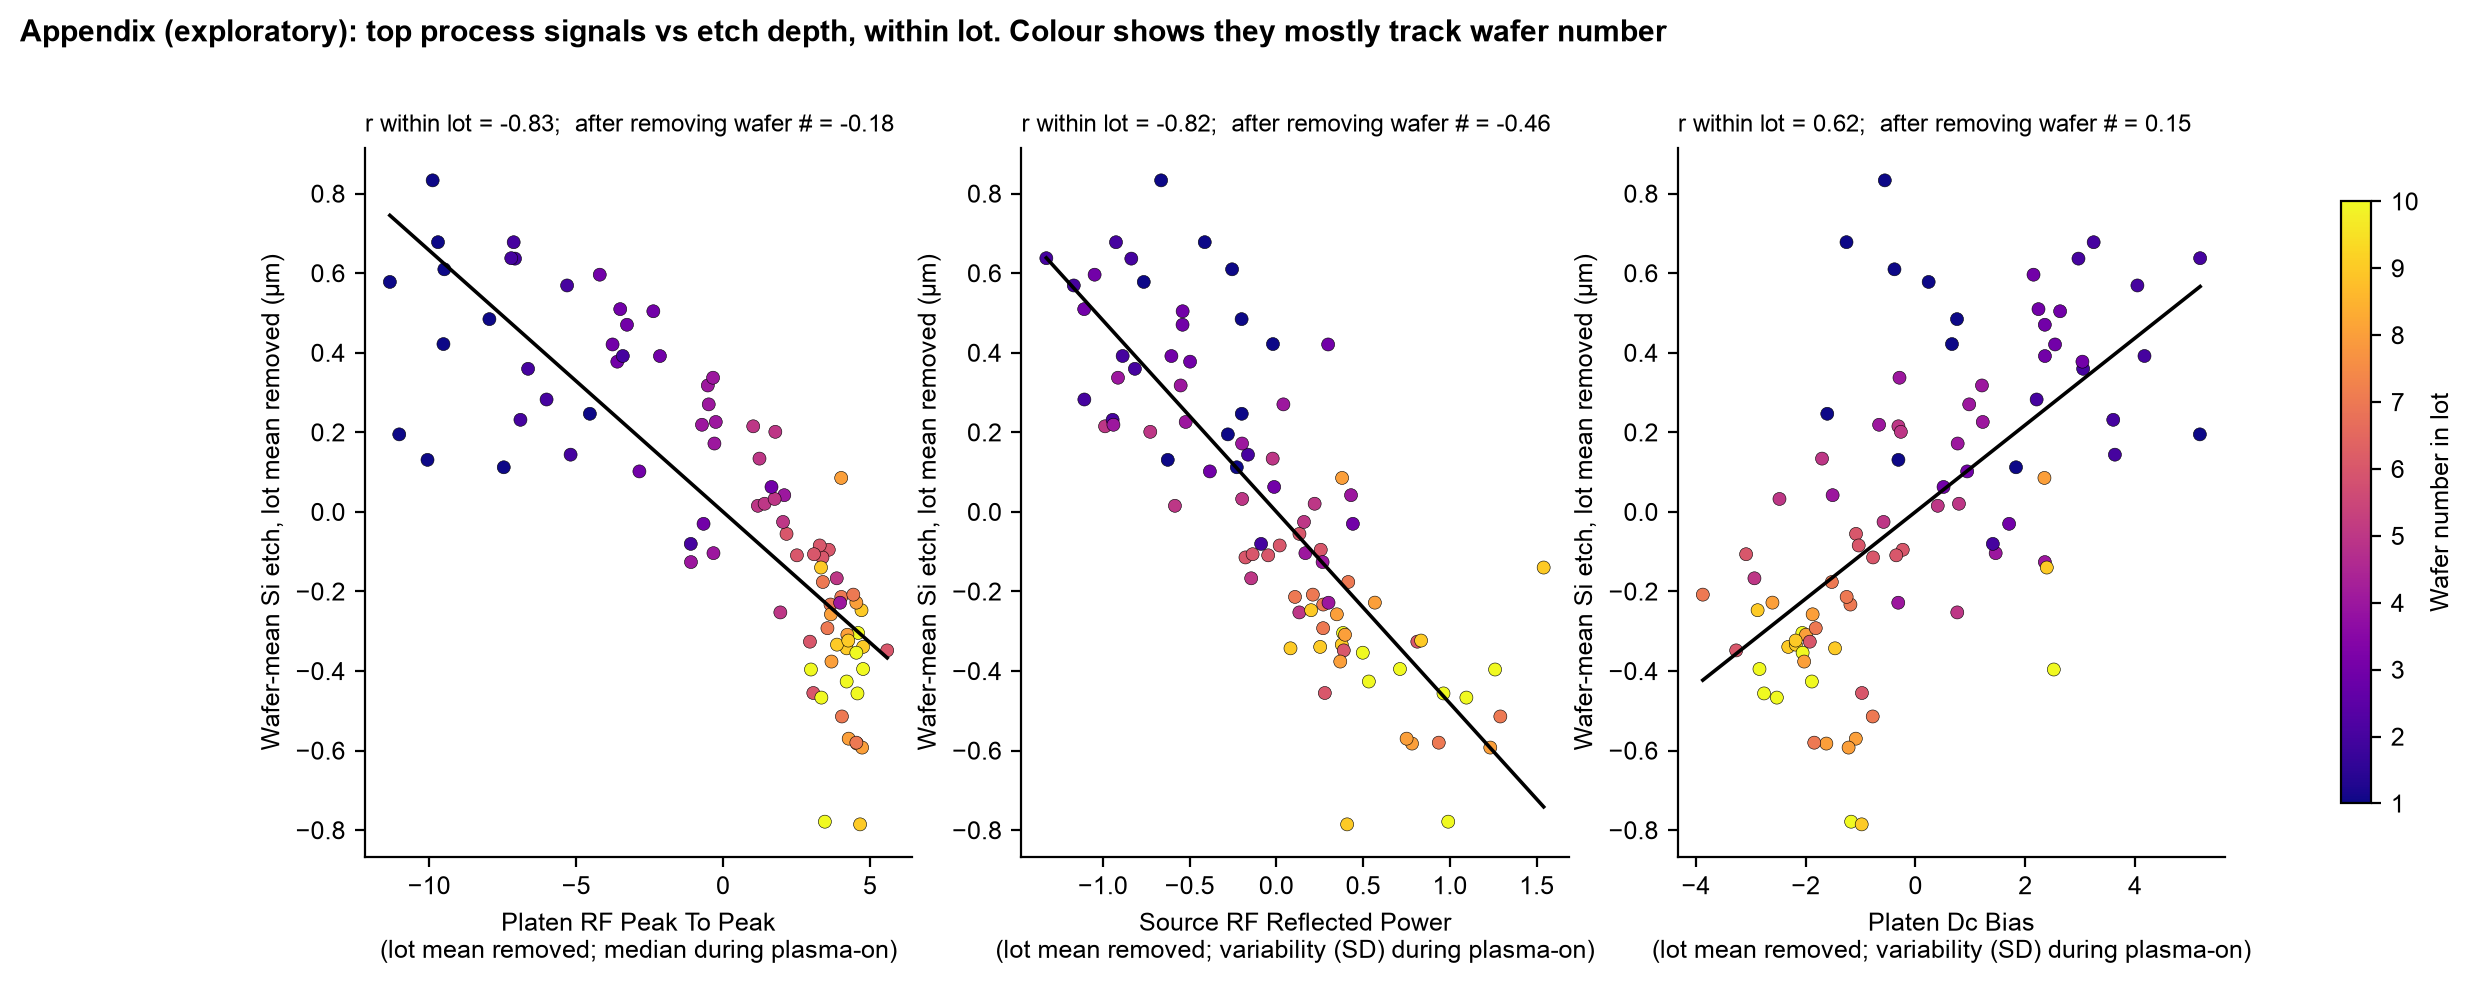
All 88 wafers
Each square is one wafer: rows are runs, columns are the order inside the run. Darker means it etched deeper. Notice how every row fades from left to right. Select a square to see its numbers.
Wafer-mean Si etch depth by lot (rows) and position (columns). Dashed outline: not in the dataset (lot 7 wafers 7–10 damaged; lot 10 wafers 5–10, lot 1 wafer 7 and lot 9 wafer 9 have no matched metrology). Red dot: NU outlier (lot 6 wafer 7, flagged site reading).
Open checks
- Explained
Two unusually low single-site readings (lot 6 wafer 7, 28.65 µm; lot 3 wafer 2, 39.23 µm). Step height alone is off by 12–16 µm against neighbours; likely profilometer errors. Drift slope unchanged without them.
- Open
Summarise process signals separately for the etch and passivation steps of each cycle.
- Open
Repeat feature selection inside each held-out-lot fold before ranking process models.
- Open
Team decision for Improve: which spec width and chip size to assume for the failure-count scenarios.
Wafer-to-wafer drift
- −0.119 µmper wafer
- ≈ 1.07 µmwafer 1 → 10
- 10 / 10lots drift down
Across the wafer
- 41.2 µmcentre
- 49.8 µmouter ring
- 8.26 %non-uniformity
Edge vs centre
- −0.74 µmcentre by wafer 10
- −1.37 µmouter ring by wafer 10
The maps show an earlier and larger decline at the edge, followed by the centre. They do not show anything physically moving inward.
Background: how it was measured
Before the findings, here is what was done. Silicon wafers were etched by a plasma machine, ten in a row, and the depth was measured at 89 spots on each wafer. Every number on this site is one of those depths.
Bosch DRIE on 200 mm Si(100) test wafers (SPTS Rapier), lots of 10 wafers after a chamber conditioning step; Si etch depth from profilometer step height minus remaining SiO₂ at 89 masked sites per wafer.
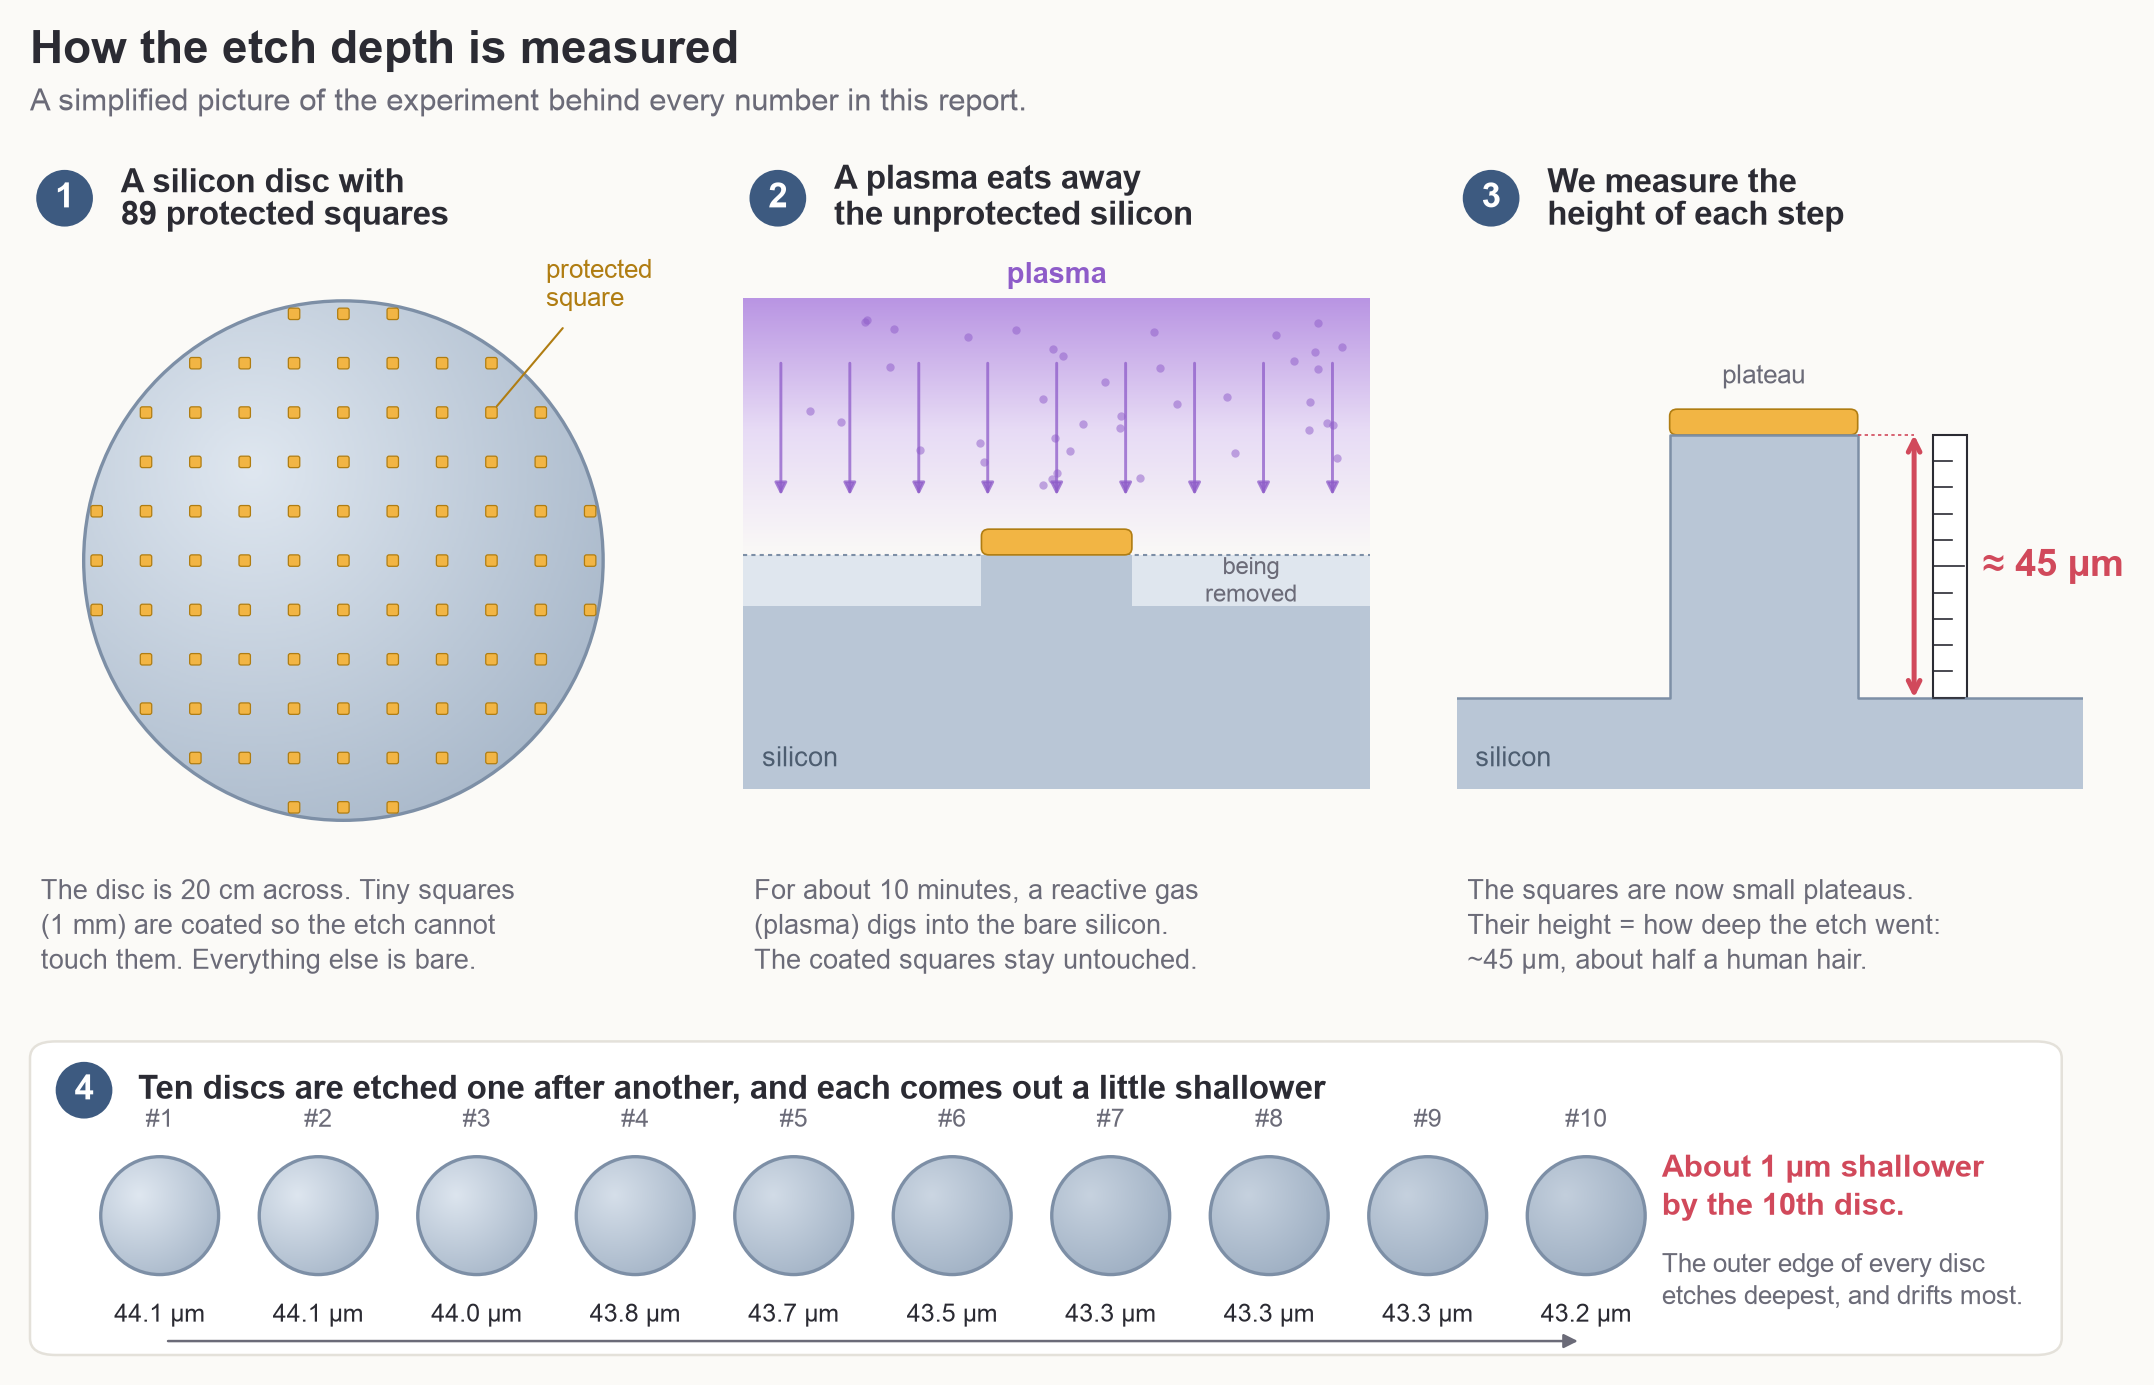
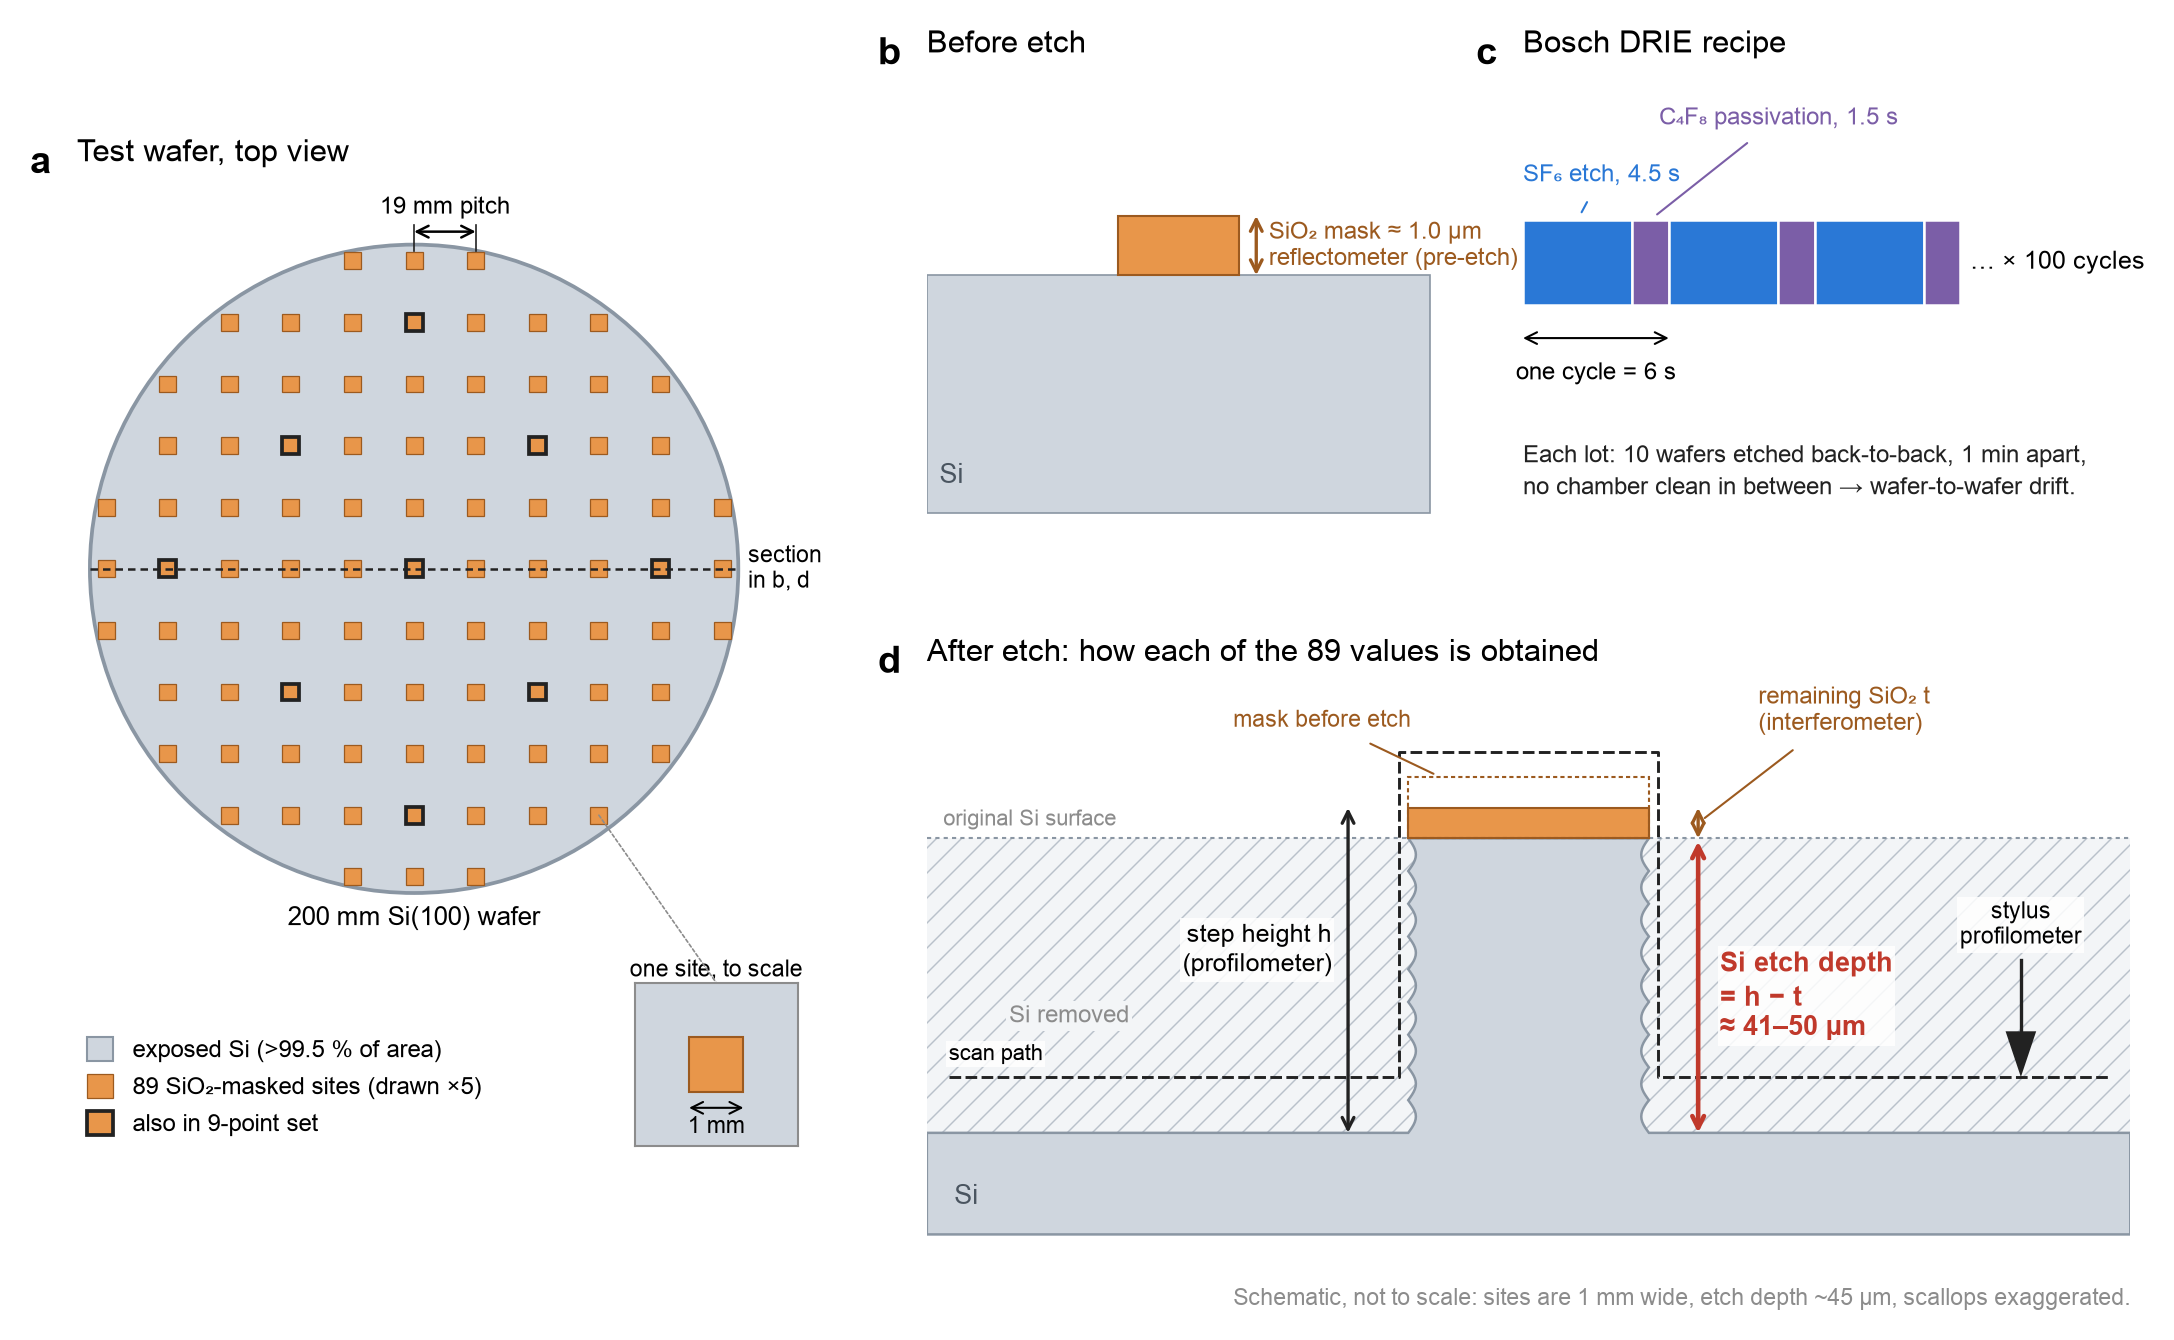
One etch, step by step
What if: spec limits Improve preview
The dataset has no pass/fail limits, so here you choose one. See how many spots on each wafer would fall outside it, and how that changes if the drift were removed. Removing the drift does not always help: with a wide band most failures are rim spots that are too deep, and the drift was making them shallower.
Illustrative only: tolerance band is user-chosen around a user-chosen target; no product spec, yield or cost data exist in the dataset. Drift removal adds back the per-site within-lot slope × (position − 1).
Machine signals Exploratory
These sensor readings rise and fall with the drift, but most of that is because they also change with wafer count. They are candidates for monitoring, not causes.